Assembly and Performance Test of Button Cell
In the initial stage of R&D and production of lithium-ion battery materials, it is necessary to measure the electrochemical performance of the assembled button cell. This article summarizes the previous literature, combined with actual work experience, and introduces the method of assembling lithium-ion button batteries in the laboratory.
The development of any new battery material usually goes through five stages: laboratory research and development, small-scale test, pilot test, scale-up and commercial application. The laboratory research and development stage is a necessary stage for material performance testing, verification and value judgment. Because laboratory measurement data has important scientific research value, it also helps to judge whether certain materials and battery systems have practical application value and commercial development value in the early development stage. In addition to testing the performance of existing materials, laboratory button batteries are also used for preliminary electrochemical performance testing and evaluation of new materials and new process products, and the development of the correct assembly of button batteries It has important significance with preparation, full battery design and application.
Preparation of Electrode
Material selection and weighing
The positive and negative materials used in the laboratory are often purchased, of course, they can also be prepared through experiments. The positive and negative electrode active materials are generally powder materials, and the particle size should not be too large to facilitate uniform coating, and at the same time avoid the limitation of the dynamic properties of the material and the unevenness of the electrode caused by the large particles. The positive and negative electrode materials used in laboratory research generally have a maximum particle diameter (Dmax) of not more than 50μm, and the Dmax of industrial lithium battery materials is generally less than 30μm. Large particles, agglomerates or nano-level materials are often screened or ground. Commonly used conductive agents for lithium batteries are carbon-based conductive agents, including conductive materials such as acetylene black (AB), conductive carbon black, Super P, and 350G. Commonly used binder systems include polyvinylidene fluoride-oily system [ie poly(vinylidene fluoride), PVDF system] and polytetrafluoroethylene-water-based system [ie poly(fluortetraethylene), generally emulsion, referred to as PTFE system], SBR Benzene rubber) emulsion, etc. Oil-based solvents often use NMP (N-methylpyrrolidone), etc.
When preparing electrode in the laboratory, the mixing ratio and steps vary depending on the test materials and mixing process. For example, in common graphite negative electrode, the content of CMC (sodium carboxymethyl cellulose) is generally less than 10%, the content of SBR is generally less than 10%, and the content of conductive additives is generally less than 10% (except for high-rate batteries) . In silicon-based anode materials, considering the poor conductivity of silicon-based anode materials, it is necessary to increase the binder content in the electrode and change the types of conductive additives. Some people adjust the ratio of CMC to 20%. The ratio is adjusted to 20%, and CNT (carbon nanotube) is added to the conductive additive; for the development and testing of high-power battery electrode, the content of the conductive agent is often increased, and the ratio can be adjusted to about 20%. The high proportion of binders and conductive additives is to fully demonstrate the electrochemical characteristics of the positive and negative active materials. In actual lithium-ion batteries, the mass ratio of the binder of the electrode pads is often about 2%, and the proportion of conductive additives is often 1% to 2 %.
The weighing accuracy of lithium-ion battery materials should not be lower than an electronic balance of 1% of the weighing mass, so as to avoid introducing large weighing errors. The active material and conductive agent can be weighed directly to weigh the powder, while the weighing of the binder is to first weigh the powder and then mix with a certain amount of solvent to prepare a binder solution (such as PVDF dissolved in NMP. 10%, mass fraction), and then calculate the solid content of the binder according to the actual added volume.
Selection of current collector
The positive and negative current collectors of the lithium-ion battery electrode are aluminum foil and copper foil respectively. If you choose a single-sided smooth foil, it is often coated on the rough surface to increase the binding force between the current collector and the material. The thickness of the foil is not strict, but there are relatively high requirements for the uniformity of the surface density of the foil. Silicon-based anode materials generally use carbon-coated copper foil to improve adhesion, reduce contact resistance, increase the reproducibility of test results, and improve charge-discharge cycle performance.
Pole piece coating preparation process
The preparation process of the laboratory pole piece is generally divided into two processes: mixing and coating. The mixing process includes manual grinding and mechanical mixing, and the coating process is manual coating and mechanical coating.
When mixing, manual grinding or mechanical mixing is determined according to the amount of material supplied. For example, manual grinding is recommended when the mass of active material is 0.1~5.0g, and when the mass of active material exceeds 5.0g, it is recommended to use The mixer performs mixing. The amount of slurry mixed in the laboratory is limited, and manual coating is often used. When the slurry is sufficient, a small coating machine can be used. The entire pole piece production process needs to be carried out in a dry environment, and the materials and equipment used need to be kept dry.
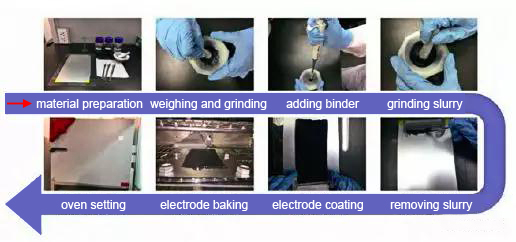
Figure 1 Hand-mixed coating process
Figure 1 shows the preparation process of the pole piece by the manual mixing coating method, including the preparation of the preliminary material, the weighing and grinding of the active material and the conductive agent, the addition of the binder, the slurry grinding, the manual coating of the pole piece, and the drying of the pole piece. The mechanical mixing process includes material preparation, instrument preparation, configuration of binder slurry, adding conductive additives, configuration of slurry, adding electrode material to configuration slurry, coating and pole piece baking (Figure 2). Note that it is necessary to add the binder (such as PVDF) to the solvent NMP first, stir under 50 ℃ until the PVDF is completely dissolved, and then proportion according to the slurry preparation ratio. During the mixing process, the material sticking to the wall should be removed and mixed into the slurry to avoid deviations in the calculation of the material ratio due to the distortion of the ratio. The mixing process time is too short or too long, uneven or too fine slurry will affect the overall quality and uniformity of the pole piece, and directly affect the electrochemical performance of the material and its evaluation.
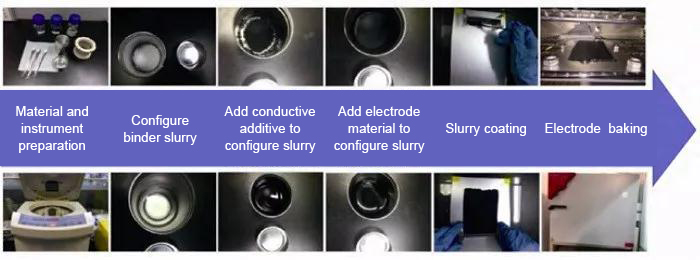
Figure 2: Mechanical mixing and manual coating process
In addition, it is particularly important to note that generally the surface capacity of the pole piece is set to 2~4mA·h/cm2, and the minimum is not recommended to be less than 1mA·h/cm2. Such active material loading is closer to industrial applications, which is convenient Accurately benchmark and evaluate the magnification and low temperature characteristics of materials. In individual cases, this load can be exceeded, for example for thick electrode research. The pole piece made below this surface capacity, on the one hand, has a large weighing error; in addition, due to the thin pole piece, the dynamic performance is better, the volume change is small, and the electrolyte is relatively excessive, which is conducive to measuring the material The maximum capacity of the battery, but the measured rate and cyclability of the half-cell battery may be significantly higher than the performance under the actual full-battery working condition. At this time, the dynamics and cyclical data results are not as good as the actual large-capacity battery Correspondence. Of course, even if there is a difference between the requirements of the actual system, if all materials are compared according to the production conditions of the same pole piece, it is also meaningful to compare the performance differences of the materials. However, the comparison of kinetics and cycle performance data under different pole piece production conditions is often low in reliability, and the consistency of thin electrode made by hand in the laboratory is often difficult to guarantee.
Pole piece drying conditions, rolling process, pole piece cutting and weighing, and pole piece baking
The drying of pole piece generally needs to consider three points: baking temperature, baking time, and baking environment. For NMP oil, the baking temperature needs to be above 100℃. Under the premise of drying, try to reduce the baking temperature and increase Baking time. For some materials that are easily oxidized or unstable in high-temperature air, they need to be baked in an inert atmosphere oven. The drying conditions can also be determined by directly measuring the moisture content of the electrode. During the rolling process of the pole piece, the pole piece needs to be compacted, and the compaction density is as close as possible to the compact density of the pole piece in the industry. In order to measure the dynamic limit of the material, the compaction density can be adjusted according to the research purpose. The prepared pole piece is clamped up and down with weighing paper and placed on the punching machine to punch out the small pole piece (Figure 3). The diameter of the small pole piece can be adjusted according to the punching die size of the punching machine. The diameter is often used in the laboratory. 14mm (corresponding to CR2032 button battery) punching die. Choose good and bad small electrode, try to choose electrode with regular appearance, smooth surface and edges, if there are burrs or flaking on the edges of the electrode, you can use a small brush for slight treatment. The number of small electrode prepared by stamping is adjusted according to the test requirements and the smear area. Generally, the number of electrode used for charging and discharging tests is not less than 5 (it is recommended to select more than 8 complete test electrode).
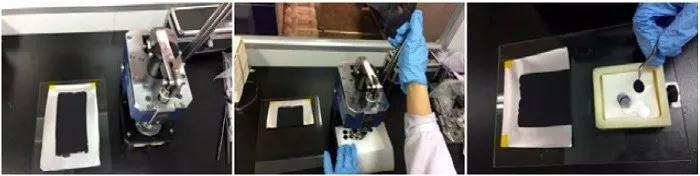
Figure 3 Process of manual stamping pole piece
Move the selected small electrode to a high-precision balance (with an accuracy of not less than 0.01 mg) for weighing, put the weighed electrode into the bag of the battery to be installed, and record the corresponding data (Figure 4). In addition to the mass weighing of the pole piece, when using a thickness gauge to measure the thickness of the pole piece, if the measured value error of multiple electrode is within 3%, the thickness uniformity of the pole piece is considered to be good, and the average thickness is recorded .
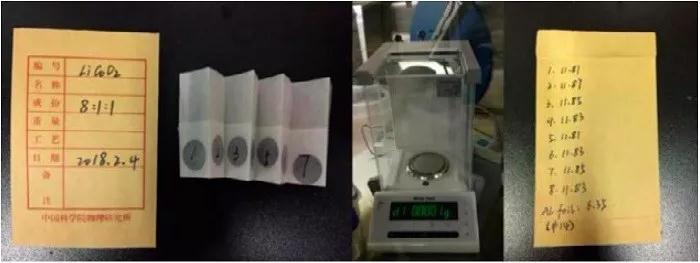
Figure 4 Weighing and marking of electrode after stamping
Put the weighed pole piece into a vacuum drying box, vacuum to 0.1MPa, set the drying temperature and time, and bake at 120 ℃ for 6 h. The purpose of this step is to further remove the moisture in the pole piece. It is recommended to mark the experiment information (Figure 5) after starting the operation and heating up to prevent other people from misoperation.
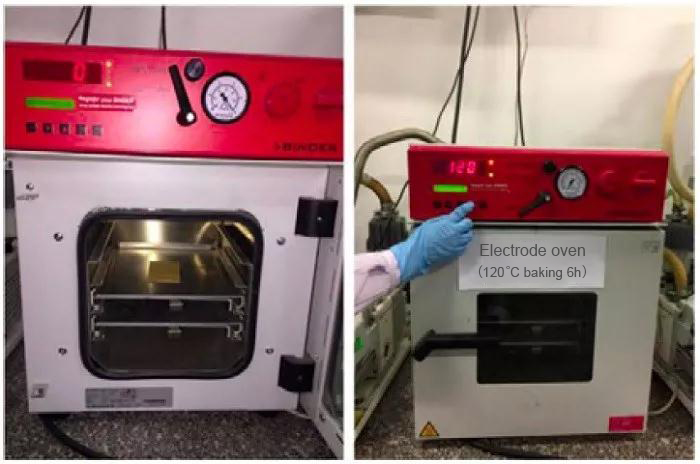
Figure 5 Drying and baking process of electrode
Double-sided electrode processing method
In the laboratory test and analysis, it also includes the analysis and evaluation of the electrochemical performance of the electrode prepared on some industrial production lines and the electrode removed from the battery cell. The above-mentioned electrode are mostly double-sided coated electrode, so the double-sided electrode must be processed into single-sided electrode (exposing the current collector) before assembling the button cell for testing. Commonly used treatment methods include the scraper method, the wipe method, and the back glue method.
The scraper method mainly uses a scalpel to scrape one side of the target electrode and can be operated directly in the glove box. However, this method is easy to damage the current collector and takes a long time, so it is not recommended.
The wiping method needs to use water as a solvent to wipe one side of the negative electrode, and the positive electrode can be wiped with NMP (N-methylpyrrolidone) as a solvent. After wiping until there is no obvious active material on the back (visual observation is sufficient), punch the sheet with a punching machine to prepare a standard size single-sided electrode. The method is simple to operate, but solvent penetration or atmosphere penetration is easy to occur, which affects the surface of the other side of the electrode. In addition, this method is difficult to prepare samples at the edge of the electrode, and is mostly used to prepare samples at the center area of the electrode.
The back adhesive method is a double-sided electrode processing method recently developed by the failure analysis team of the Institute of Physics of the Chinese Academy of Sciences (hereinafter referred to as the Institute of Physics). It uses edge folding and conductive adhesive on the back to wrap the back of the target electrode in the set. Inside the fluid and conductive glue, a single-sided electrode is formed. The method is simple to operate, and can conveniently sample any part on the double-sided electrode to make a single-sided electrode, and the whole process can be completed in a glove box.
The target electrode sample after single-sided treatment needs to be cleaned in order to remove the lithium salt and residual electrolyte on the electrode surface. The commonly used method is to soak the single-sided electrode in a solvent such as DMC for 6-8 hours, or use blunt tweezers to pick up the target electrode sample, and use a pipette or a dropper to suck DMC, which contains activity on the target electrode. Wash the front side of the substance several times, or use a combination of the two methods. After cleaning, place the electrode in a vacuum chamber and vacuum dry to remove the solvent. Cleaning and vacuum drying are carried out in the glove box. The dried electrode can be placed in a flat mold to keep the electrode flat, which is convenient for later assembly of button batteries.
Button battery assembly method
Transfer the prepared electrode to an inert atmosphere glove box to prepare the button battery assembly parts: negative electrode shell, metal lithium sheet, diaphragm, gasket, spring sheet, positive electrode shell, electrolyte, in addition, a sheet die, transfer Liquid dispenser and insulated tweezers.
The assembly process is shown in the figure below: Lay the negative electrode case flat on the insulating table, place the metal lithium sheet in the center of the negative electrode case, and flatten the metal lithium sheet with a tablet die, and then lay the diaphragm flat on the upper layer of the lithium sheet. Pipette an appropriate amount of electrolyte droplets onto the surface of the diaphragm. Use insulated tweezers to place the test electrode, gasket, spring sheet, and positive electrode case on the upper layer of the diaphragm in turn, where the active material side of the test electrode must be close to the diaphragm (Figure 6).
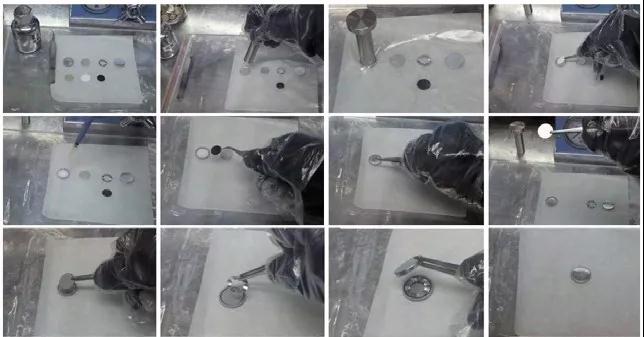
Figure 6 Button battery assembly process
Further, use insulated tweezers to place the button battery with the negative side up on the button battery sealing machine mold, and use a paper towel to pad the battery to absorb the overflowing electrolyte, adjust the pressure (generally 800Pa) and press for 5 seconds to complete the assembly. Take out the battery with insulated tweezers, observe whether the appearance of the preparation is complete (Figure 7) and wipe it clean with a paper towel.
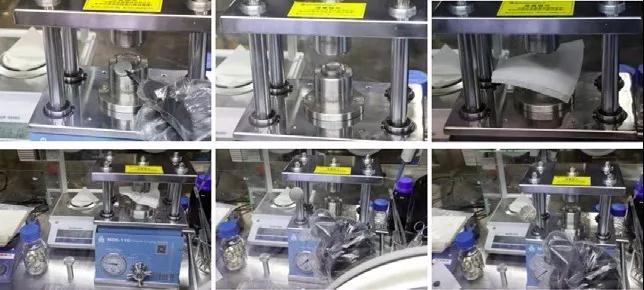
Figure 7 Button cell packaging process
The assembly process of the simulated battery is similar to the button battery. Take the simulated battery assembly of the Institute of Physics of the Chinese Academy of Sciences as an example. The assembly materials to be prepared include: a simulated battery mold (a PTFE liner, a PTFE sleeve, positive and negative Electrode shell and metal conductor post), metal lithium sheet, diaphragm, electrolyte and electrode to be tested. The size of the electrode to be tested cannot exceed the size of the PTFE liner. As shown in the figure below, put the lithium metal sheet, the diaphragm, and the PTFE liner into the negative shell mold in sequence, and then use a pipette to drop a certain amount of electrolyte, and put the electrode piece to be tested and the metal conductor column into it in sequence In the bladder, ensure that the active material side is close to the diaphragm. Further, the positive electrode shell mold covered with the polytetrafluoroethylene sleeve is installed on the negative electrode shell mold to complete the assembly of the simulated battery.
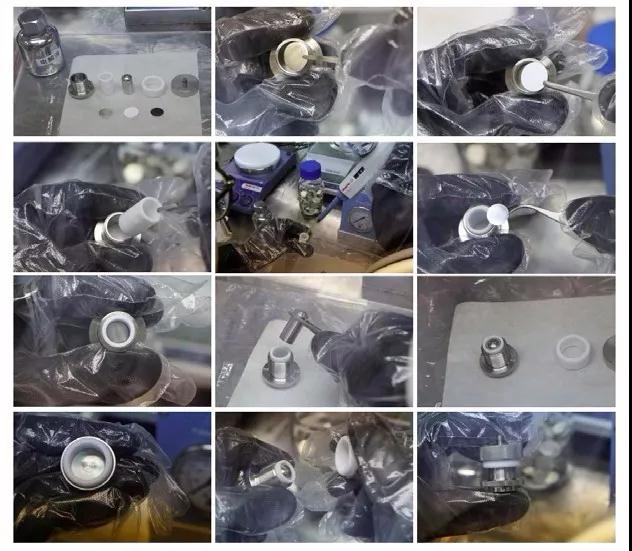
Figure 8 Simulation battery assembly flow chart
Precautions in the preparation of laboratory button batteries
Selection and treatment of lithium metal sheet, diaphragm and electrolyte
Lithium metal chips for laboratory use can provide a far excess of lithium source (1mA·h/cm2 is equivalent to 5 μm thick lithium foil, and the actual lithium chips purchased are often 400~500μm, which is equivalent to 80~100mA·h/cm2. The single-sided capacity of high-grade positive and negative electrode is generally 2~4 mA·h/cm2), with less impurities and the size needs to be larger than the electrode to be tested. Generally, metals under inert atmosphere protection can be purchased directly from related companies or suppliers Lithium tablets are disassembled and used in an inert atmosphere protective glove box. It is required that the purity of the lithium sheet used is not less than 99.9%, and the diameter of 15~15.8mm (corresponding to the CR2032 button battery with the electrode size of 14mm) is often used when preparing button half-cells, the thickness is 0.5~0.8 mm, and the surface is flat and straight. Silver-white shining, no oil spots, perforations and tears.
The type of diaphragm needs to be selected according to the experimental requirements. Generally, it is an insulating film with nanopores, which can allow two-way transmission of ions after adsorbing the electrolyte. Single-layer or multi-layer polyethylene or polypropylene diaphragms are often used. Generally, commercial diaphragms are selected. The diaphragm of the punching machine is used to prepare a circular shape with regular dimensions. The size needs to be larger than the lithium metal sheet and the electrode to be tested in order to isolate the positive and negative electrodes. It is usually the same as the inner diameter of the button battery case (for example, the diaphragm diameter of CR2032 is 15.5 ~16.5 mm). Industrial polypropylene membranes of Celgard2400 or Celgard2500 models are often used in laboratories.
When assembling button-type lithium-ion batteries in laboratories, the LiPF6 system electrolyte is usually selected [such as the electrolyte of lithium iron phosphate batteries is generally a LiPF6 solution with a concentration of 1mol/L, and EC/DEC is 1:1 (volume ratio) mixed Liquid as a solvent], and can be selected according to experimental requirements, such as choosing a common ratio electrolyte, an electrolyte containing one or more additives, etc. The amount of electrolyte used in button battery assembly is usually excessive. For example, the amount of electrolyte used in button battery 2032 is generally 100-150 μL, and the amount of electrolyte used in simulated batteries is generally 200 μL. If a long cycle test is required, the amount of electrolyte can be appropriately increased.
The advantages and disadvantages of preparing electrode and batteries
The surface of the prepared electrode is smooth, without obvious large particles, and there is no obvious material drop during the baking, cooling at room temperature, and transfer. It can be preliminarily judged that the electrode is qualified. Furthermore, the quality and thickness of the electrode, and the degree of material drop at the back edge of the punching piece can be compared. If the quality and thickness of the electrode are very different, the edge of the electrode wafer is good or bad, indicating the preparation of the electrode Is not qualified. The electrode with uniform quality, thickness and edge drop should be selected for testing.
The prepared button battery and the simulated battery shell mold are flat and undamaged, and the surface has no corrosion marks and no obvious leakage. Use a multimeter or battery tester to test the open circuit voltage of the prepared battery. The open circuit voltage of the positive electrode material half-cell is above 3 V, and the negative electrode material half-cell open circuit voltage is within 2.5 ~ 3.5 V, indicating that the assembled battery has no obvious short circuit. If the open circuit voltage is abnormal The assembled battery can be regarded as unqualified. Mark the necessary battery information with a marker on the positive case of the button battery that has passed the screening.
Precautions
In a button half-cell with metallic lithium as the negative electrode, the negative material in the full battery is actually the positive electrode in the button cell at this time. In button batteries, it is necessary to ensure that the diameter of the diaphragm>the diameter of the lithium sheet>the diameter of the electrode. When using tweezers to move the entire button battery, insulated tweezers are required to prevent the positive and negative electrodes from contacting and short-circuiting. In order to ensure the later electrochemical test items and take into account errors and operational errors, the number of button batteries or simulated batteries assembled in the laboratory of the same material is generally not less than 5. In the step of placing the lithium sheet during the preparation process of button batteries and simulated batteries, place the edge of the lithium sheet smoothly toward the side of the diaphragm. If necessary, use a flat hard object that does not react with lithium to flatten the surface of the metal lithium sheet to prevent lithium The edge burrs pierced the diaphragm and caused the battery to short circuit. The button cell and analog battery components need to be cleaned before use. The stainless steel parts can be ultrasonically cleaned with degreaser cleaner, acetone, ethanol, and water in sequence. When using degreaser cleaner, the cleaning temperature can be appropriately increased. The purpose of removing oil stains on the surface of parts. Teflon parts are cleaned with several other reagents besides acetone. The cleaned parts need to be dried in an oven. When simulating battery assembly and placing the electrode, please note that the electrode is easy to move and flip. When using tweezers to adjust, it is easy to cause electrode damage and electrolyte side leakage. It is recommended to use blunt insulated tweezers for handling.
Guide: I have completed the battery assembly method of the previous period. The next thing to do is to test the battery performance. What are the battery performance test methods? What should I pay attention to?
The charging and discharging test method of button lithium battery
Button battery charge and discharge mode
The charging and discharging tests of button lithium batteries often use constant current charging (CC), constant current-constant voltage charging (CC-CV), constant voltage charging (CV), and constant current discharge (DC) to test and analyze the battery charging and discharging behavior And other data, by analyzing the changes in the data during the process to characterize the electrochemical performance parameters such as the capacity of the battery or material, the Coulomb efficiency, the charging and discharging platform, and the changes in the internal parameters of the battery.
The step charge and discharge mode is mostly used to test the performance of DC internal resistance, polarization and diffusion impedance. Considering the influence of the content of active material and the size of the electrode on the test current, the constant current charging often appears in the form of current density, such as mA/g (current per unit mass of active material), mA/cm2 (current per unit electrode area) .
The size of the charge and discharge current is often expressed by the charge and discharge rate, that is: charge and discharge rate (C) = charge and discharge current (mA) / rated capacity (mA·h), such as a battery with a rated capacity of 1000mA·h with a current of 500mA Charge and discharge, the charge and discharge rate is 0.5 C. At present, the industry standard QCT/743-2006 for lithium-ion batteries used in electric vehicles has been published and pointed out that the general charge and discharge current of lithium-ion is C/3, so C/3-containing charge-discharge behavior tests often appear in the laboratory. The battery is being charged and discharged.
Rate performance test
There are three forms, including the use of the same rate of constant current and constant voltage charging, and the constant current discharge test at different rates to characterize and evaluate the performance of lithium-ion batteries at different discharge rates; or use the same rate for constant current discharge with different rates Rate constant current charging test, which characterizes the charging performance of the battery at different rates; and the same rate is used for charging and discharging tests. Commonly used charge and discharge rates are 0.02C, 0.05C, 0.1C, C/3, 0.5C, 1C, 2C, 3C, 5C and 10C.
When testing the cycle performance of the battery, it is mainly necessary to determine the charge and discharge mode of the battery. Periodically cycle until the battery capacity drops to a certain value (usually 80% of the rated capacity), the number of charge and discharge times the battery has experienced, or Compare the remaining capacity of the battery after the same cycle of cycles to characterize the cycle performance of the test battery. In addition, the test environment of the battery has a certain impact on its charge and discharge performance.
In the process of testing lithium batteries in the laboratory, explosion-proof boxes and thermostats are often used (Figure 1). The battery explosion-proof box used in the laboratory is mostly used for the testing of large-capacity batteries. It is also used when studying some special performance tests of button batteries, such as high-rate and high-temperature performance tests. The temperature control of the laboratory incubator is mostly 25 ℃, and the accuracy of the temperature difference between the actual temperature and the set temperature does not exceed 1 ℃. In the high and low temperature performance test of the battery, the lowest temperature can reach 70 ℃ and the highest temperature can reach 150 ℃. Considering that the incubator with a wide temperature range is more expensive and the application is more concentrated, it is recommended that multiple incubators be set at different temperatures for centralized testing, that is, the same verification material is assembled with multiple button batteries to test the room temperature and high and low temperature performance respectively. Commonly used temperatures for laboratory testing are 25 ℃, 55 ℃ and 80 ℃ (Figure 2). When choosing a thermostat, try to use a thermostat specially designed for battery testing. This type of thermostat contains a professional insulation port for connecting battery test leads. When connecting the battery to the test fixture, you need to use insulated tweezers, and the test battery should be neatly placed in an explosion-proof box or a constant temperature box, set the test temperature, and open the battery test program after the temperature reaches the set temperature. It is recommended to label and comment the test during the test Information (Figure 3).
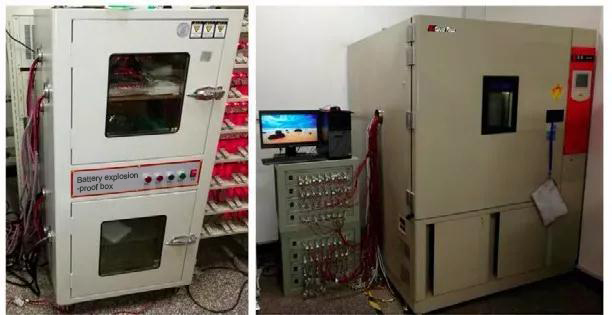
Figure 1 Battery explosion-proof box and thermostat for laboratory
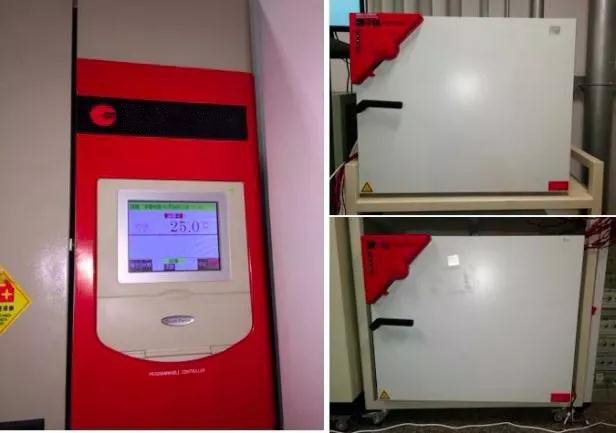
Figure 2 Laboratory incubators with different set temperatures
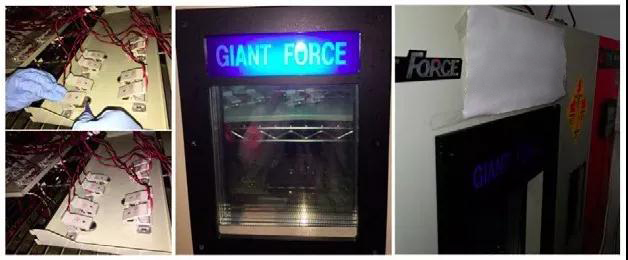
Figure 3 Installation diagram of button battery in thermostat
Routine experiment procedure of charge and discharge test
Install the test battery on the test instrument and place it in a test environment of (25±1)℃. Set the following procedures: stand for 10 minutes; charge to 4.2 V with a constant current of 1.0C, then charge at a constant voltage until the current drops to 0.05C, and the charging stops; stand for 5 minutes; then discharge to 3.0V with a constant current of 1.0C; Repeat the above charging and discharging steps 5-10 times.
The above test parameters are conventional full battery test parameters. Generally, the voltage range of positive electrode material/metal lithium button battery is 3.0~4.3V, and the voltage range of negative electrode material/metal lithium button battery is 0.005~1.0V, special high-voltage cathode material (Such as high-voltage lithium cobalt oxide, spinel lithium nickel manganese oxide, lithium-rich manganese-based layered oxide and other materials) or other cathode materials (such as lithium iron phosphate materials) can be based on the characteristics of the electrode material and the electrolyte and solid electrolyte resistance The oxidation voltage is adjusted in the voltage range, and other parameters remain unchanged. Anode materials/metal lithium button batteries and lithium-free cathode materials (such as MnO2, etc.)/metal lithium button batteries are first discharged to the lowest voltage window and then charged. It should be noted that the current negative electrode material test range in many articles is 0.005~3.0V, and in the full battery test process, the voltage range that can generally be used corresponds to the negative half-cell test and actually does not exceed 1.0V, for example, Graphite or silicon-based negative electrode materials can have a voltage range of 0.005 to 0.8V. For lithium titanate, a negative electrode material, the voltage range is 1.2 to 1.9V. Therefore, for some articles, the high capacity and high first coulombic efficiency obtained in a wide voltage range cannot be used in a full battery, and the actual significance is not great. For soft carbon or hard carbon anode materials, or composite metal lithium anode materials currently under development, the discharge cut-off voltage can be lower, such as 0mV or even 50mV, and specific circumstances require specific analysis. It is recommended that most of the negative electrode materials have a half-cell test control voltage range of 0.005 to 1.0V. If this voltage range is exceeded, special statements are required in the statement of the results and the description of the application prospects to avoid exaggerating the results.
When testing the actual capacity of the battery material, try to use a small rate for charging and discharging to reduce the capacity error caused by polarization and obtain the true capacity of the battery. Generally, a rate of 0.1C is selected for testing.
Operators need to wear insulated gloves, masks and protective glasses when loading and unloading button batteries on the test instrument; due to the large number of test channels, special marks must be made on the test battery and test channels, and eye-catching labels should be attached to the relevant instruments to prevent others Misoperation.
Routine experiment process of charge and discharge cycle test
When testing the cyclability of the battery, you can increase the number of cycles on the basis of the above charge and discharge test (section 2), and compare the capacity retention rate after the same number of cycles. Or repeat the charge and discharge cycle. When the discharge capacity is lower than 80% of the initial discharge capacity for two consecutive times, determine the number of cycles at this time.
High and low temperature test routine experiment process
In the high and low temperature performance test of lithium ion battery, the high temperature performance test is generally set to 45 ℃, 55 ℃, 80 ℃ or higher temperature, and the low temperature performance test is generally set to 0 ℃, -10 ℃, -20 ℃, -30 ℃ or- At 40°C, the test procedure is the same as in Sections 2, 3, and 4. The test data needs to be compared with the room temperature data, so the charge and discharge test at room temperature is required before the high and low temperature test (that is, the test content in Section 2). When performing discharge efficiency test, it is recommended to charge to 100% SOC in constant current-constant voltage (CC-CV) mode at room temperature (25±1) ℃, and perform constant current discharge after standing at different temperatures for 30 minutes ( DC).
Basic data analysis
Voltage analysis
The open circuit voltage of the assembled lithium-ion battery refers to the potential difference between the positive and negative electrodes when there is no current through the external circuit. It can be directly measured by a multimeter (with an accuracy of not less than 0.1 mV, and a special voltmeter with high internal impedance is recommended to prevent self-discharge) , Or read the value directly after connecting to the battery test system. This value is only the initial open circuit voltage after the battery is assembled. The open circuit voltage at full SOC needs to be measured by the constant current intermittent titration (GITT) method, which will be introduced in a subsequent article. The working voltage refers to the instantaneous potential difference between the positive and negative poles when the external circuit has current, which can be directly reflected in the battery test system data. Working voltage U=E0±IRi, where E0 is the thermodynamic equilibrium voltage, Ri is a certain resistance in the button cell or in contact, such as the ohmic resistance, charge transfer resistance, and diffusion resistance of a structural element, I Is the test current. The working voltage is related to the current.
The average discharge voltage analysis requires formula processing on the curve, that is, in the formula, Qmax is the discharge capacity in the curve, and E is the ordinate voltage of the discharge curve.
Capacity analysis
Battery capacity is one of the important performance indicators of lithium-ion battery performance. It represents the amount of electricity stored in lithium-ion batteries under certain conditions, usually in A·h (ampere hour) or mA·h (milliampere hour) as the unit (1 A ·H=1000 mA·h), the main method for obtaining the capacity parameters of lithium-ion batteries is when the battery is discharged from 100% SOC to 0% SOC (that is, within the test voltage range), the current is integrated with time, that is, Among them, Q is the battery capacity (A·h), I is the current (A), and t is the test time (h). 1 milliampere hour is equivalent to 3.6 coulombs. Generally, the capacity data can be read directly in the test system software.
For the battery materials tested, capacity analysis generally needs to determine three data: first charge capacity, first discharge capacity (cathode material) and reversible capacity.
- The first charge capacity is the charge capacity of the lithium-ion battery at the end of the first charge;
- The first discharge capacity is the discharge capacity at the end of the first discharge of the lithium-ion battery;
- The reversible capacity is the capacity value after the battery is cycled stable (the test value at room temperature is also called the rated capacity). Generally, the discharge capacity of the 3rd to 5th week is selected, and sometimes the discharge capacity after 10 weeks may be selected.
In practical applications, the analysis of the gram capacity, surface capacity and volume capacity of the test material or electrode has more reference value. For example, gram capacity is the discharge capacity per unit mass of active material, C=Q/m; area capacity is the discharge capacity per unit test electrode area, C=Q/S; volume capacity is the discharge capacity per unit electrode volume, C=Q /V. In the formula, C is the discharge specific capacity mA·h/g (milliamp hour per gram), mA·h/cm2 (milliamp hour per square centimeter) or mA·h/cm3 (milliamp hour per cubic centimeter), Q Is the discharge capacity mA·h (milliampere hour), m is the mass of the active material g (g), S is the test electrode area cm2 (square centimeter), and V is the test electrode volume cm3 (cubic centimeter). The gram capacity parameter is used to compare the performance of the test material more intuitively, while the area capacity and volume capacity are more valuable for the practical application of the test material, when the positive and negative capacities are matched. It is recommended to provide 3 kinds of specific capacity information at the same time when publishing an article.
Button battery data can also evaluate the energy density (W) of the positive electrode active material, which refers to the energy that can be stored and released per unit mass of the positive electrode active material, W=EQ/m, which is the product of the average discharge voltage and the gram capacity, The commonly used unit is W·h/kg (often called specific energy), which also includes volumetric energy density W·h/L. Generally, the mass ratio of the positive electrode active material in the battery cell is 30%-50%, and the specific ratio depends on the compaction density and the true density of the positive electrode material. Therefore, according to the energy density of the positive electrode active material, the energy density of the corresponding full battery can also be roughly estimated. This is of reference significance for the development of full battery without conditions, but hopes to evaluate the positive electrode material and predict the energy density of the cell.
Charge and discharge curve analysis
The charge-discharge curve reflects the charge-discharge behavior of the battery material. The analysis of the button battery charge-discharge curve is of great significance for understanding the performance and electrochemical behavior of the material, especially the analysis of the half-cell charge-discharge curve, which can be targeted The characteristic behavior of a certain material. There are several different forms of charging and discharging curves, such as the more common “cross-type” curve (Figure 1) and “cyclical” curve (Figure 2).
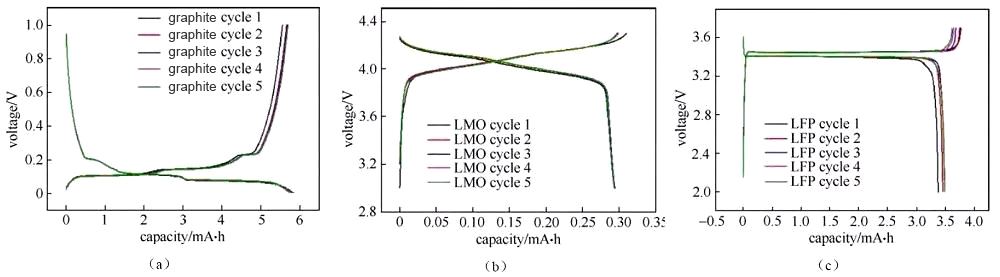
Figure 1 “Crossed” charge and discharge curves of half-cells assembled from several different materials
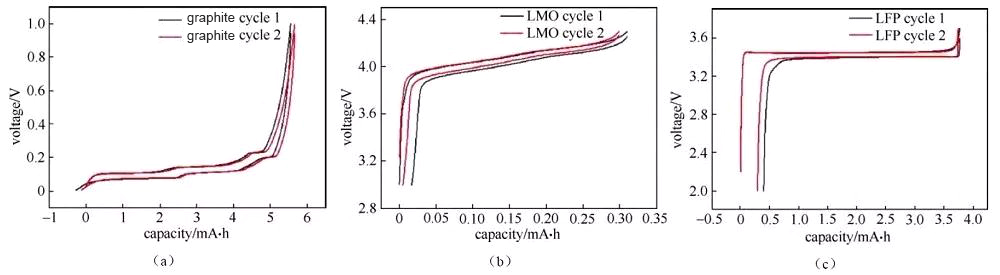
Figure 2 “Cyclic” charge and discharge curves of half-cells assembled with several different materials
A large amount of data information can be read from the button battery charge and discharge curve. The following is a brief introduction to the reading and analysis of some data.
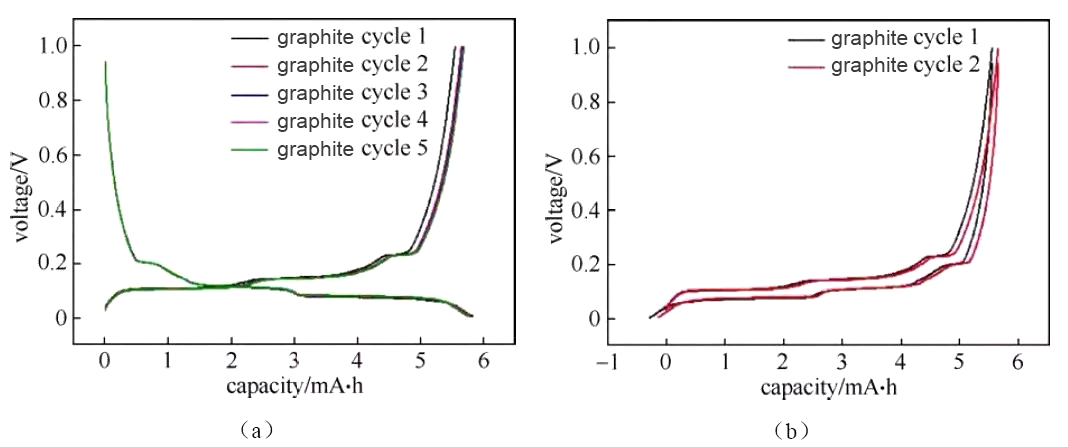
Figure 3 Charging and discharging curves of graphite/metal lithium button half-cell
The deintercalation of lithium ions in the positive and negative materials corresponds to the plateau or slope area on the charge and discharge curve (and the redox peak in the cyclic voltammetry curve and the differential tolerance curve), and the material can be analyzed and studied according to the changes in each plateau area The electrochemical reaction behavior. Generally, the number of potential platforms or slopes for charging and discharging is the same. If the total capacity of charging and discharging is the same, but the corresponding capacity of each platform/slope is different, it indicates the thermodynamic reaction path or power of lithium insertion and removal of the material There are significant differences in academic characteristics. Figure 3 shows the charge and discharge curves of a typical graphite anode material. The charge-discharge curve shows that during the charging and discharging of the graphite/lithium metal sheet half-cell, there are three distinct charge-discharge platforms at 0.08/0.1 V, 0.11/0.14 V, and 0.2/0.22 V during the charge-discharge process of the graphite electrode. The two-phase transition process of three lithium-graphite intercalation compounds is described. The starting point of the platform corresponds to the beginning of the phase transition, the end point of the platform, and the end point of the phase transition. The platform behavior means that the electrochemical potential of the host material has nothing to do with the occupancy of ions in the material. The slope in the charge-discharge curve generally corresponds to the solid solution reaction or capacitance behavior. The slope behavior means that the electrochemical potential of the host material is directly related to the occupancy rate of ions in the material. Therefore, the charge-discharge curve can be used to preliminarily determine how many phase transitions the material has during the reaction process, whether it is a two-phase transition reaction or a solid solution, absorption and desorption capacitance behavior, which can assist in guiding structural studies such as X-ray diffraction. Under the same SOC, when charging and discharging with a small current, the intermediate value of the voltage between the charge potential platform and the discharge potential platform is approximately the thermodynamic equilibrium potential. Use the cyclic voltammetry curve or the differential tolerance curve corresponding to the intermediate potential value of the oxidation peak and the reduction peak Easier to estimate accurately. It is recommended to use the GITT method under low current density for the accurate measurement of thermodynamic equilibrium potential under full SOC.
In the discharge behavior of a full battery, the discharge voltage of the battery is the lithium insertion voltage of the positive electrode material minus the delithiation voltage of the negative electrode material. Therefore, the higher the average delithiation platform of the negative electrode, the lower the discharge voltage of the full battery. When the delithiation platform of the negative electrode material exceeds 2.0 V, the full battery voltage is already very low. At this time, the measured capacity is of little significance to full battery matching and practical applications, because each electrical application has an allowable lower limit voltage range For example, the discharge voltage of lithium-ion batteries generally used in consumer electronics is 2.7 V.
Energy efficiency is the ratio of discharge energy to charging energy in the same cycle, which can be expressed as η=(EDQD)(/ECQC)×100%. In the charge-discharge curve, it can be approximated to the difference of the integral area of the charge-discharge curve, and the change of this value is easier to read in the “cyclic” charge-discharge curve. The energy efficiency of a typical lithium-ion battery is between 92% and 95%, while the energy efficiency of lithium-sulfur batteries and lithium-air batteries are around 80% and 70%, respectively.
Analyzing the charge and discharge cycle data of the first 5 weeks, the first week discharge capacity, the first week charge capacity, the first week Coulomb efficiency, the reversible capacity, the polarization voltage and resistance, and energy efficiency can be obtained.
The first week of charge and discharge data is the most important. The discharge capacity of the first week can be directly read in the curve, which is used to analyze the actual discharge capacity of the electrode after the first cycle. The charging and discharging platform in the first week of the battery lays the foundation for the subsequent cycles. Whether the structure of most materials is stable is also produced in the first week. The length of the platform also affects the efficiency of lithium ion insertion and extraction. The charging and discharging capacity in the second week and later are basically rising and falling on the basis of the discharge capacity in the first week. Coulomb efficiency (ie, charge and discharge efficiency) refers to the ratio of battery discharge capacity to charge capacity during the same cycle, that is, η=QD/QC×100%, and the first week Coulomb efficiency (ie first effect) is the battery in the first week The ratio of discharge capacity to charge capacity (cathode material η=QD1/QC1×100%). Many battery test systems can directly output this value, which can be used to analyze the capacity of the electrode consumed by activation and other reactions during the first week of cycling, and can directly characterize the stability of the material structure and the pros and cons of the dynamic performance.
The first discharge capacity and the first week Coulomb efficiency can directly affect the design and material evaluation of the full battery. The Coulombic efficiency in the first 5 weeks generally shows a trend of first increasing and then decreasing or small fluctuations. This is due to the irreversible loss of active lithium source caused by reactions such as SEI film growth and material activation during the cycle of the first few weeks. Taking a half-cell with fresh negative electrode material as an example, its first discharge capacity is higher than the first charge capacity, that is, the amount of lithium inserted into the negative electrode for the first time is greater than the amount of lithium removed from the negative electrode for the first time. If the test result is opposite, it may be caused by factors such as non-fresh electrode or short circuit of the battery.
The maximum capacity, that is, the highest value of the capacity displayed during the charging and discharging process of the test battery, generally appears in the charging and discharging process of the first five weeks. The test results of some anode materials show that the reversible capacity continues to increase as the number of cycles increases, which is related to the continuous oxidation of the material, the slow activation, the continuous growth of the SEI film, and the gradual participation of other materials in the oxidation reaction. This type of negative electrode material is a disadvantage rather than an advantage for the design and application of lithium ion batteries. Generally speaking, the reversible capacity measured by the battery will tend to be relatively stable in the first 5 weeks. The Coulomb efficiency cannot reach 99.95% quickly, which means that the interface or material structure has been unstable. Such materials are used for full-cell testing, compared to half-cells. , The cyclicality will be much worse.
Electrozation analysis
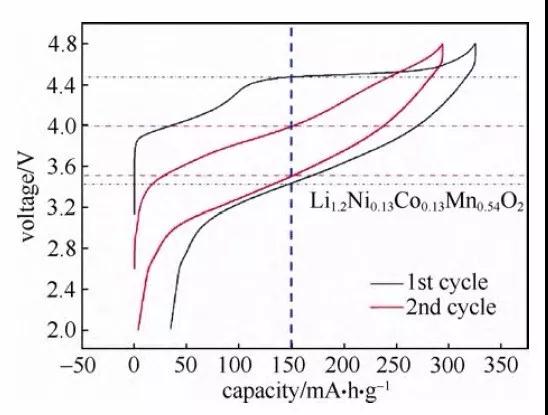
Figure 4 Charge and discharge curve of lithium-rich cathode material (Li1.2Ni0.13Co0.13Mn0.54O2)
In the process of charging and discharging lithium batteries, polarization is inevitable, especially during high-rate charging and discharging. It is necessary to study the capacity change caused by polarization and analyze the polarization according to the charge-discharge curve. Compared with the analysis of electrode process dynamics through GITT, constant voltage intermittent titration (PITT) or electrochemical impedance spectroscopy (EIS), through charge and discharge The dynamic information obtained by the curve is more intuitive. Generally, the capacity measured at lower charge and discharge rates (such as 0.05C, 0.02C, 0.01C or lower, depending on the material) can basically ignore the change in capacity caused by polarization. The difference between the capacity value tested under a certain rate and the capacity value tested under the above-mentioned low rate can be regarded as the capacity change caused by polarization. In the constant current-constant voltage (CC-CV) charging constant current discharge curve, the polarization can be characterized by the ratio of the constant current charging capacity to the constant voltage charging capacity in the charging curve. The lower the ratio of constant current charging capacity to total charging capacity or the higher the ratio of constant voltage charging capacity to total charging capacity, the greater the polarization. In addition, the increase in the voltage difference between the charge and discharge platforms in the charge and discharge curve can also reflect the increase in electrode polarization, and the difference is easier to read in the “cyclic” charge and discharge curve. A preliminary understanding can be made through the vertical axis gap of the charge-discharge curve of the curve. As shown in Figure 4, the charge-discharge curve of the lithium-rich cathode material (Li1.2Ni0.13Co0.13Mn0.54O2) is compared with the first cycle curve. The vertical axis gap of the 2-week cycle curve is small, indicating a decrease in polarization. In addition, this value can also be characterized by the potential difference between the lithium insertion and removal peaks in the differential tolerance curve. The greater the potential difference, the greater the polarization.
Differential curve analysis
In the process of analyzing the battery charge and discharge curve, in order to facilitate the study of the charge and discharge curve, the curve is differentiated, and the plateau area is converted into a peak curve. The commonly used methods are differential capacity curve (incremental capacity, dQ/dV vs. V) and differential voltage curve (differential voltage, dV/dQ vs. Q) to analyze the charge and discharge curves.
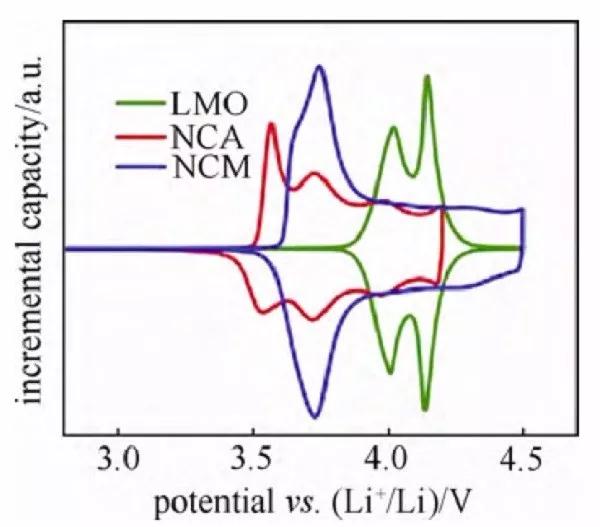
Figure 5 Differential tolerance curves of several cathode material half-cells
Among them, the differential tolerance curve, referred to as the IC curve (Figure 5), is widely used, but due to the existence of a voltage platform (that is, dV=0), data processing needs to be cautious. The oxidation peak and reduction peak in the curve correspond to the charge platform and discharge platform in the charge-discharge curve, and have a corresponding relationship with the oxidation peak and reduction peak in the cyclic voltammetry curve. According to the peak position in the curve, references can be used to confirm and judge the redox reaction. Differentiate the charge and discharge curves of the same cycle and perform peak position comparison to show the middle value of the corresponding redox peak potential is the thermodynamic equilibrium potential. In addition, the shift and attenuation of peak positions also have a certain comparative value. For example, the movement of the peak position indicates that the charge and discharge platform potential near the potential has moved, which is related to the difficulty of lithium insertion and extraction caused by the structural change of the material; the intensity change of a certain peak position can characterize the change in the length of the charge and discharge platform of the potential.
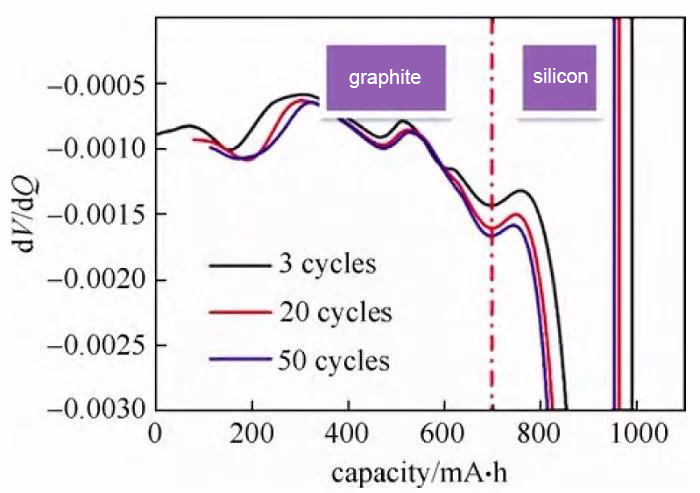
Fig. 6 Differential voltage curve of the discharging process of the silicon-carbon hybrid material/metal lithium sheet half-cell
Differential voltage curve, referred to as dV curve, can compare the attribution of the peak position of the curve according to literature or experiment, and initially judge the capacity performance of different materials or platforms according to the abscissa of the peak position. The data processing of this curve is more convenient and it is mostly used for mixing. Material electrode analysis. Figure 6 shows the dV curve of the discharging process of the silicon-carbon hybrid material/lithium metal sheet half-cell. Through comparative analysis, it can be concluded that in the third cycle discharge capacity, the capacity of silicon material is 293 mA·h, and the capacity of graphite is It is 697.6 mA·h, and the capacity of silicon and graphite decreases with cycling. It should be noted that whether the data of the differential capacitance and differential voltage curve is smooth, and the voltage measurement accuracy of the charge and discharge instrument, the current control accuracy, the temperature stability during the test, and the density of the sampling point have an impact.
View more quliaty Button Cell equipments